【書評・感想】Getting Started with D3 eBook
2013-08-18-1
[BookReview][Programming]
D3 というのは、カッコイイおしゃれグラフがかける JavaScript ライブラリ。それの入門書「Getting Started with D3」を読みました。
■Mike Dewar / Getting Started with D3 eBook
書中のコードを書いて動作を確認して、とじっくり読み進めました。とりあえず、一通りいじって概略はつかめたので、今後さらに勉強して使い込んで、かっこいいグラフをじゃんじゃん作って、ハッタリを効かせた人生を送りたいと思います。なにはともあれ、手元のデータを分かりやすくプレゼンテーションするってのはほんと大事ですからねえ。
Pdf版が無料で入手できます。私はこちらを読みました。iPad で。
- Getting Started with D3 - Free Download eBook - pdf
http://it-ebooks.info/book/835/
英語ですが実質50ページくらいで短いですし、コードも多いので、英語苦手な人でも大丈夫かと。
この本のサンプルコード。若干異なるので注意(PDF版だったからかも)。サンプルデータは「The New York Metropolitan Transit Authority Data Set」で、バスや地下鉄の統計情報。
- http://examples.oreilly.com/0636920025429/mikedewar-getting_started_with_d3-bdfc34e/visualisations/
§
D3のオフィシャルサイト:
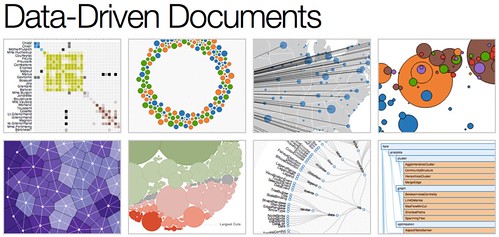
D3.js - Data-Driven Documents
http://d3js.org/
サンプル、実例、たくさん。どこかで見かけたことがあるものも。みんなD3使ってたのかー。
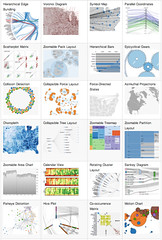
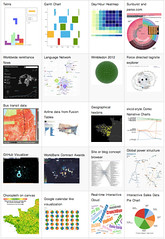
Gallery - mbostock/d3 Wiki - GitHub
https://github.com/mbostock/d3/wiki/Gallery
■Mike Dewar / Getting Started with D3 eBook
Learn how to create beautiful, interactive, browser-based data visualizations with the D3 JavaScript library. This hands-on book shows you how to use a combination of JavaScript and SVG to build everything from simple bar charts to complex infographics. You’ll learn how to use basic D3 tools by building visualizations based on real data from the New York Metropolitan Transit Authority.
書中のコードを書いて動作を確認して、とじっくり読み進めました。とりあえず、一通りいじって概略はつかめたので、今後さらに勉強して使い込んで、かっこいいグラフをじゃんじゃん作って、ハッタリを効かせた人生を送りたいと思います。なにはともあれ、手元のデータを分かりやすくプレゼンテーションするってのはほんと大事ですからねえ。
Pdf版が無料で入手できます。私はこちらを読みました。iPad で。
- Getting Started with D3 - Free Download eBook - pdf
http://it-ebooks.info/book/835/
英語ですが実質50ページくらいで短いですし、コードも多いので、英語苦手な人でも大丈夫かと。
この本のサンプルコード。若干異なるので注意(PDF版だったからかも)。サンプルデータは「The New York Metropolitan Transit Authority Data Set」で、バスや地下鉄の統計情報。
- http://examples.oreilly.com/0636920025429/mikedewar-getting_started_with_d3-bdfc34e/visualisations/
§
D3のオフィシャルサイト:
D3.js - Data-Driven Documents
http://d3js.org/
D3.js is a JavaScript library for manipulating documents based on data. D3 helps you bring data to life using HTML, SVG and CSS. D3’s emphasis on web standards gives you the full capabilities of modern browsers without tying yourself to a proprietary framework, combining powerful visualization components and a data-driven approach to DOM manipulation.
サンプル、実例、たくさん。どこかで見かけたことがあるものも。みんなD3使ってたのかー。
Gallery - mbostock/d3 Wiki - GitHub
https://github.com/mbostock/d3/wiki/Gallery
この記事に言及しているこのブログ内の記事